FLIT Invest is committed to no green-washing, no pink-washing, and no impact-washing. When you invest in companies that claim to do good, you want to see the evidence, right? We believe this too. Our team of dedicated analysts conducts hours of research to bring you the impact of your investments—the metrics and figures of your real-term impact by investing in our portfolios. FLIT Invest provides impact tracking for carbon metrics, thematic metrics, and UN SDG mapping – but what does it all mean? This article will go into more depth on what our thematic metrics capture and what those awesome numbers in your app mean for the world.
How does FLIT Invest choose thematic metrics?
For every theme we conduct impact analysis using a variety of metrics. We utilize the Global Impact Investing Network’s (GIIN) metric platform, IRIS, to ensure our analysis meets industry standards. Whilst we do all this behind-the-scenes work, in the app you will find 3 core metrics for each of your chosen investment themes. Below is a summary of which metrics are presented for each environmental theme when you invest with FLIT Invest – you can scroll down to look at each one in detail. Stay tuned for part 2 with social impact metrics.
Climate Solutions: carbon emissions avoided, waste & materials saved, lives improved.
Green Energy: clean energy generated, carbon emissions avoided, lives improved.
Clean Water: lives improved, water supplied, water saved or treated.
What metrics are shown for Climate Solutions?
Carbon Emissions Avoided
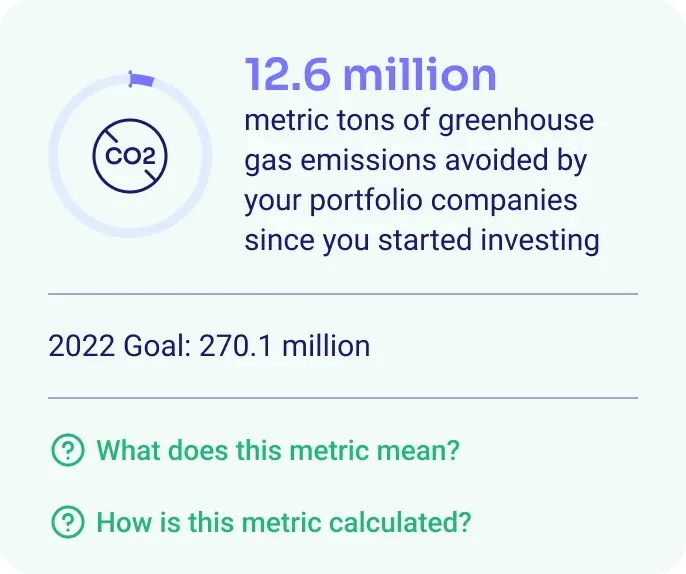
This metric explains the greenhouse gas emissions impact of your portfolio companies’ products (goods or services) relative to the situation if they did not exist. We present to you the metric tons of greenhouse gas emissions avoided by your portfolio companies since you started investing. Guidance to estimate and report avoided emissions was developed by the Greenhouse Gas Protocol. They supply the world’s most widely used greenhouse gas accounting standards, which are used by over 90% of Fortune 500 companies.

This is a neutral framework for estimating and disclosing the greenhouse gas emissions impact of a product, relative to the situation if they did not exist, considering the full life cycle emissions of a product.
Waste & Materials Saved
This metric explains the amount of waste and materials (in tons) diverted from disposal by the organizations through reuse and recycling and the amount of waste reduced or avoided with the use of their products (goods or services) during a year. We present to you the tons of waste reused, recycled, reduced or avoided by your portfolio companies since you started investing. Standards for companies to measure their waste related performance are created and supervised by the Global Reporting Initiative (GRI) and the Sustainability Accounting Standards Board (SASB).

Most companies use these standards to report their waste management operational metrics, including waste and other materials reused or recycled.
Lives Improved
This metric represents the aggregate number of people whose lives were positively affected by your portfolio companies’ products (goods or services) during a year. This is presented to you as the number of people’s lives that have been improved by your portfolio companies since you started investing. Portfolio companies usually report their product sales figures, customer numbers, or number of households served which are then aggregated and presented to you by FLIT Invest.

Our impact analysts gather this data from each company that you are invested in within this theme, may perform estimations in particular cases, but do not verify the companies’ reported figures.
What metrics are shown for Green Energy?
Clean Energy Generated
This metric captures the total potential energy production of the renewable energy products that were sold during the reporting period. We present to you the gigawatt hours (GWh) of clean energy generated by your portfolio companies since you started investing. Energy companies typically report their energy generation figures as megawatt hours (MWh), or gigawatt hours (GWh). In some cases, however, they only report the total generation capacity in megawatt (MW) or gigawatt (GW) and not the actual energy generated.

In these cases, FLIT converts the MW or GW figures to GWh by using the respective capacity factors provided by the United States Environmental Protection Agency (US EPA) for a given period. FLIT then aggregates all GWh figures and presents them to you.
Carbon Emissions Avoided
This metric explains the greenhouse gas emissions impact of your portfolio companies’ products (goods or services) relative to the situation if they did not exist. We present to you the metric tons of greenhouse gas emissions avoided by your portfolio companies since you started investing. Guidance to estimate and report avoided emissions was developed by the Greenhouse Gas Protocol. They supply the world’s most widely used greenhouse gas accounting standards, which are used by over 90% of Fortune 500 companies.

This is a neutral framework for estimating and disclosing the greenhouse gas emissions impact of a product, relative to the situation if they did not exist, considering the full life cycle emissions of a product.
Lives Improved
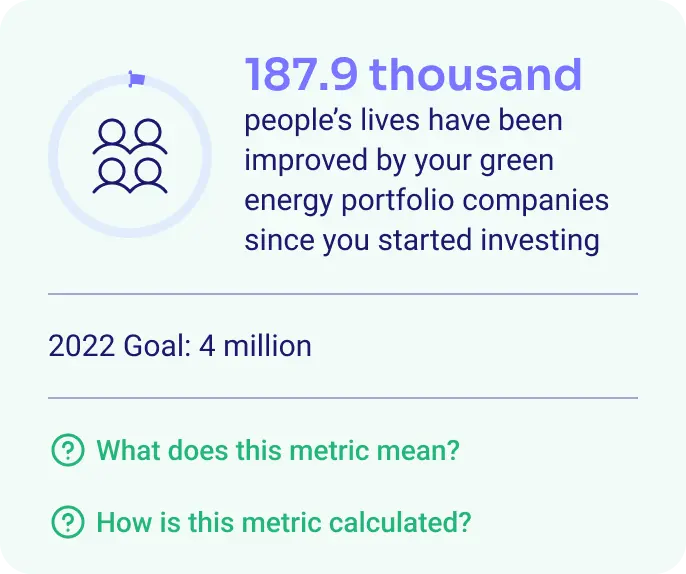
This metric represents the aggregate number of people whose lives were positively affected by your portfolio companies’ products (goods or services) during a year. This is presented to you as the number of people’s lives that have been improved by your portfolio companies since you started investing. Portfolio companies usually report their product sales figures, customer numbers, or number of households served which are then aggregated and presented to you by FLIT Invest.

Our impact analysts gather this data from each company that you are invested in within this theme, may perform estimations in particular cases, but do not verify the companies’ reported figures.
What metrics are shown for Clean Water?
Water Supplied
This metric captures the aggregate amount of water (in billion gallons) that your portfolio companies produced or provided for sale (not including water produced for their own consumption) by water utility companies. Potable water is safe enough for human consumption or use for domestic purposes, drinking, cooking, and personal hygiene with low risk of immediate or long-term harm. This is presented to you as gallons of water supplied by your portfolio companies since you started investing.

There are no standards that require companies to disclose the amount of water they supply. However, utility companies often disclose this figure as it shows investors how much water was sold by the organizations, which clarifies the reach of their services. These ‘supplied water’ figures, are then aggregated and presented to you by FLIT.
Water Saved or Treated
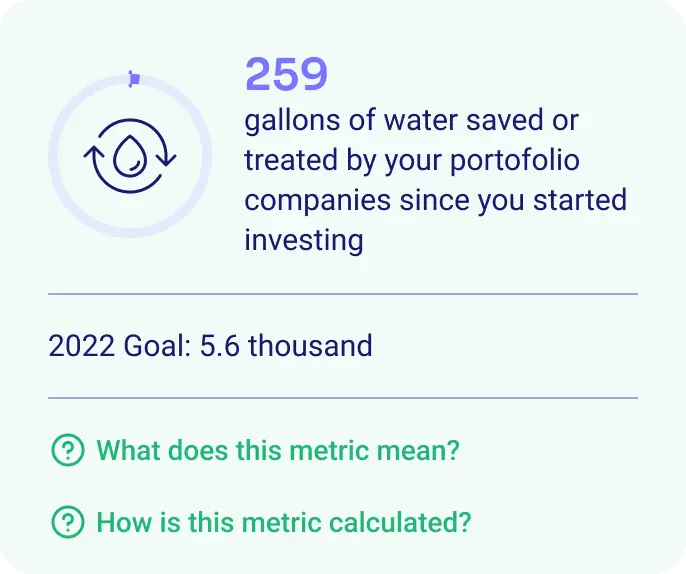
This metric captures the aggregate amount of water (in billion gallons) that your portfolio companies saved or treated. It is related to wastewater companies that treat water as part of their core operation, as well as water infrastructure companies, that provide valuable services in reducing the overall water use of households and industrial processes through innovative solutions. We present to you the gallons of water saved or treated by your portfolio companies since you started investing.

There are no standards that require companies to disclose the amount of water they saved or treated. However, wastewater and water infrastructure companies often disclose this figure as it helps investors understand the reach of their services. These ‘water saved or treated’ figures, are then aggregated and presented to you by FLIT.
Lives Improved
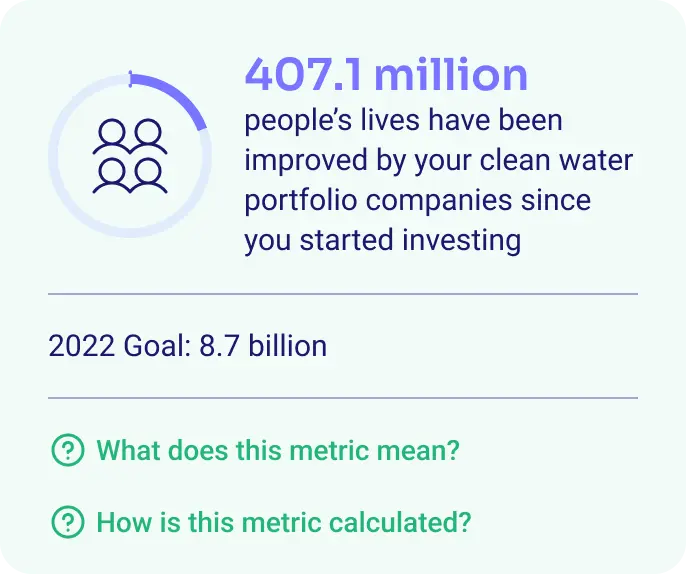
This metric represents the aggregate number of people whose lives were positively affected by your portfolio companies’ products (goods or services) during a year. This is presented to you as the number of people’s lives that have been improved by your portfolio companies since you started investing. Portfolio companies usually report their product sales figures, customer numbers, or number of households served which are then aggregated and presented to you by FLIT Invest.

Our impact analysts gather this data from each company that you are invested in within this theme, may perform estimations in particular cases, but do not verify the companies’ reported figures.
FLIT Invest is proud to be America’s first automated impact investment app with impact tracking. Join the community by downloading the app today and watch your impact grow!


