FLIT Invest is committed to no green-washing, no pink-washing, and no impact-washing. When you invest in companies that claim to do good, you want to see the evidence, right? We believe this too. Our team of dedicated analysts conducts hours of research to bring you the impact of your investments—the metrics and figures of your real-term impact by investing in our portfolios. FLIT Invest provides impact tracking for carbon metrics, thematic metrics, and UN SDG mapping – but what does it all mean? This article will go into more depth on what our thematic metrics capture and what those awesome numbers in your app mean for the world.
How does FLIT Invest choose thematic metrics?
For every theme we conduct impact analysis using a variety of metrics. We utilize the Global Impact Investing Network’s (GIIN) metric platform, IRIS, to ensure our analysis meets industry standards. Whilst we do all this behind-the-scenes work, in the app you will find 3 core metrics for each of your chosen investment themes. Below is a summary of which metrics are presented for each social theme when you invest with FLIT Invest – you can scroll down to look at each one in detail. Flick back to part 1 for environmental impact metrics.
Affordable Healthcare: lives improved, medical costs covered, prescriptions provided
Pet Welfare: pet lives improved, veterinary costs covered, pet products provided
Gender Equality: board seats held by women, women senior managers, women leaders (CEO/CFO)
What metrics are shown for Affordable Healthcare?
Medical Costs Covered
This metric represents the aggregate amount of medical costs and benefits that were covered by your portfolio companies. These are companies either involved in the public health insurance market, providing Medicare and Medicaid services, or private insurance companies providing plans for individuals and employers. This is presented to you as dollars’ worth of medical costs and benefits covered by your portfolio companies since you started investing.

Health insurance companies are required to disclose their medical expenses and benefits paid for their policyholders in their audited annual reports (10-K) which are then aggregated and presented to you by FLIT. FLIT impact analysts gather this data directly from each company’s disclosures that you are invested in.
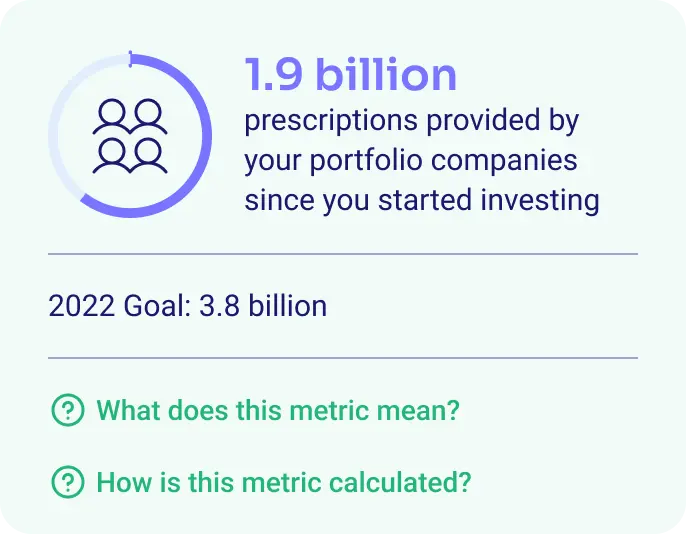
Prescriptions Provided
This metric represents the aggregate number of prescriptions filled in by doctors during consultations or treatments, and the prescriptions that were fulfilled by the pharmacies and medical distributors. We present this to you as prescriptions provided by your portfolio companies since you started investing. There are no standards that require companies to disclose the number of prescriptions provided. However, healthcare services provider and distributor companies often disclose this figure as it helps investors understand the reach of their services.

FLIT impact analysts gather this data from each company that you are invested in within this theme, may perform estimations in particular cases, but do not verify the companies’ reported figures.
Lives Improved
This metric represents the aggregate number of people whose lives were positively affected by your portfolio companies’ products (goods or services) during a year. This is presented to you as the number of people’s lives that have been improved by your portfolio companies since you started investing. Portfolio companies usually report their product sales figures, customer numbers, or number of households served which are then aggregated and presented to you by FLIT Invest.

Our impact analysts gather this data from each company that you are invested in within this theme, may perform estimations in particular cases, but do not verify the companies’ reported figures.
What metrics are shown for Pet Welfare?
Pet Lives Improved
This metric represents the aggregate number of animals whose lives were positively affected by your portfolio companies’ products (goods or services) during a year. We present to you the number of pet lives that have been improved by your pet welfare portfolio companies since you started investing. Portfolio companies usually report their product sales figures, customer numbers, or number of animals served which are then aggregated and presented to you by FLIT.

FLIT impact analysts gather this data from each company that you are invested in within this theme, may perform estimations in particular cases, but do not verify the companies’ reported figures.
Veterinary Costs Covered
This metric represents the aggregate amount of medical costs and benefits that were covered by your portfolio companies or reimbursed to pet owners by them. These are provided by companies involved in pet insurance. We present this to you as dollars of vet expenses covered by your portfolio companies since you started investing. Pet insurance companies are required to disclose their medical expenses and benefits paid for their policyholders in their audited annual reports (10-K) which are then aggregated and presented to you by FLIT.

FLIT impact analysts gather this data directly from each company’s disclosures in your portfolio.
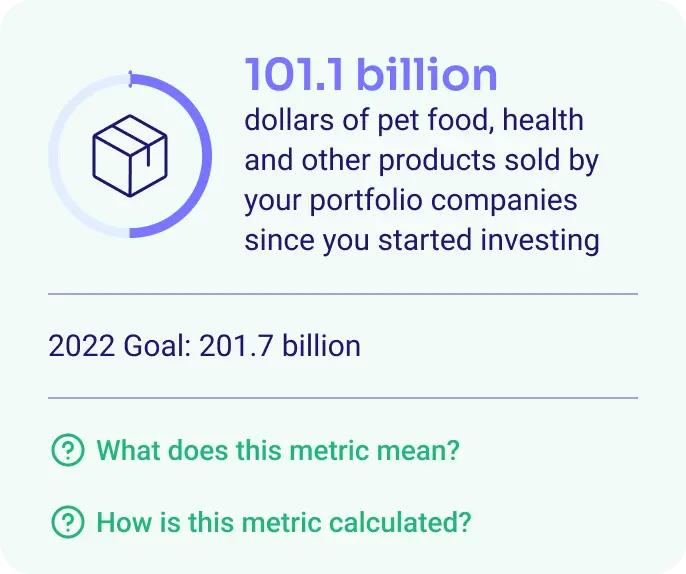
Pet Products Provided
This metric represents the aggregate amount of dollars of products (goods or services) sold by your portfolio companies during a year. You are presented with dollars of pet food, health and other products sold by your portfolio companies since you started investing. Portfolio companies usually report their revenue or sales figures which are then aggregated and presented to you by FLIT. FLIT impact analysts gather this data from each company that you are invested in within this theme, may perform estimations in particular cases, but do not verify the companies’ reported figures.

What metrics are shown for Gender Equality?
Board Seats Held By Women
This metric shows the representation of women on the board of directors, in executive management, and in key leadership positions, are essential to drive equality and promote a sustainable future. Your portfolio companies have 31% more board seats held by women than the global average. Genders of board members, senior managers, and leaders are noted based on company disclosures and the split is calculated accordingly. Companies provide the gender of their employees in their disclosures.

Global average is calculated based on the companies inside the MSCI World Index which include the largest companies in the world that are usually part of a well-diversified investment portfolio. This metric is reported by the asset manager of the gender equality fund through their fact sheets and presented to you by FLIT.
Women Senior Managers
This metric shows the representation of women on the board of directors, in executive management, and in key leadership positions are essential to drive equality and promote a sustainable future. Your portfolio companies have 46% more women in senior management positions than the global average. Genders of board members, senior managers, and leaders are noted based on company disclosures and the split is calculated accordingly. Companies provide the gender of their employees in their disclosures. Global average is calculated based on the companies inside the MSCI World Index like the other Gender Equality metrics.

Companies provide the gender of their employees in their disclosures. Global average is calculated based on the companies inside the MSCI World Index like the other Gender Equality metrics.
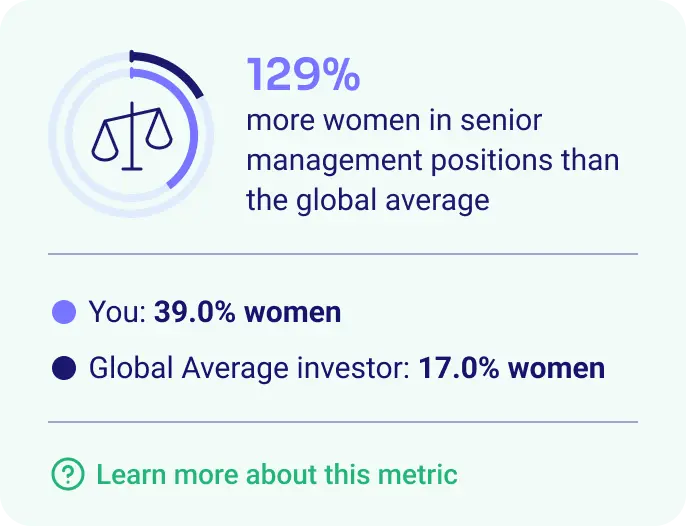
Women Leaders (CEO/CFO)
Representation of women on the board of directors, in executive management, and in key leadership positions are essential to drive equality and promote a sustainable future. The Chief Executive Officer (CEO) is the leader of the company, while the Chief Financial Officer (CFO) is the leader of the financial division of the company. Both are members of the senior management of the company and arguably the two most important positions within all sorts of companies. Your portfolio companies have 129% more women in key leadership positions (CEO/CFO) than the global average.

Genders of board members, senior managers, and leaders are noted based on company disclosures and the split is calculated accordingly. Companies provide the gender of their employees in their disclosures. Global average is calculated based on the companies inside the MSCI World Index like the other Gender Equality metrics.
FLIT Invest is proud offer a fully automated impact investment app with impact tracking. Join the community by downloading the app today and watch your impact grow!


